Documentation

Understand the metrics behind your engineering insights.

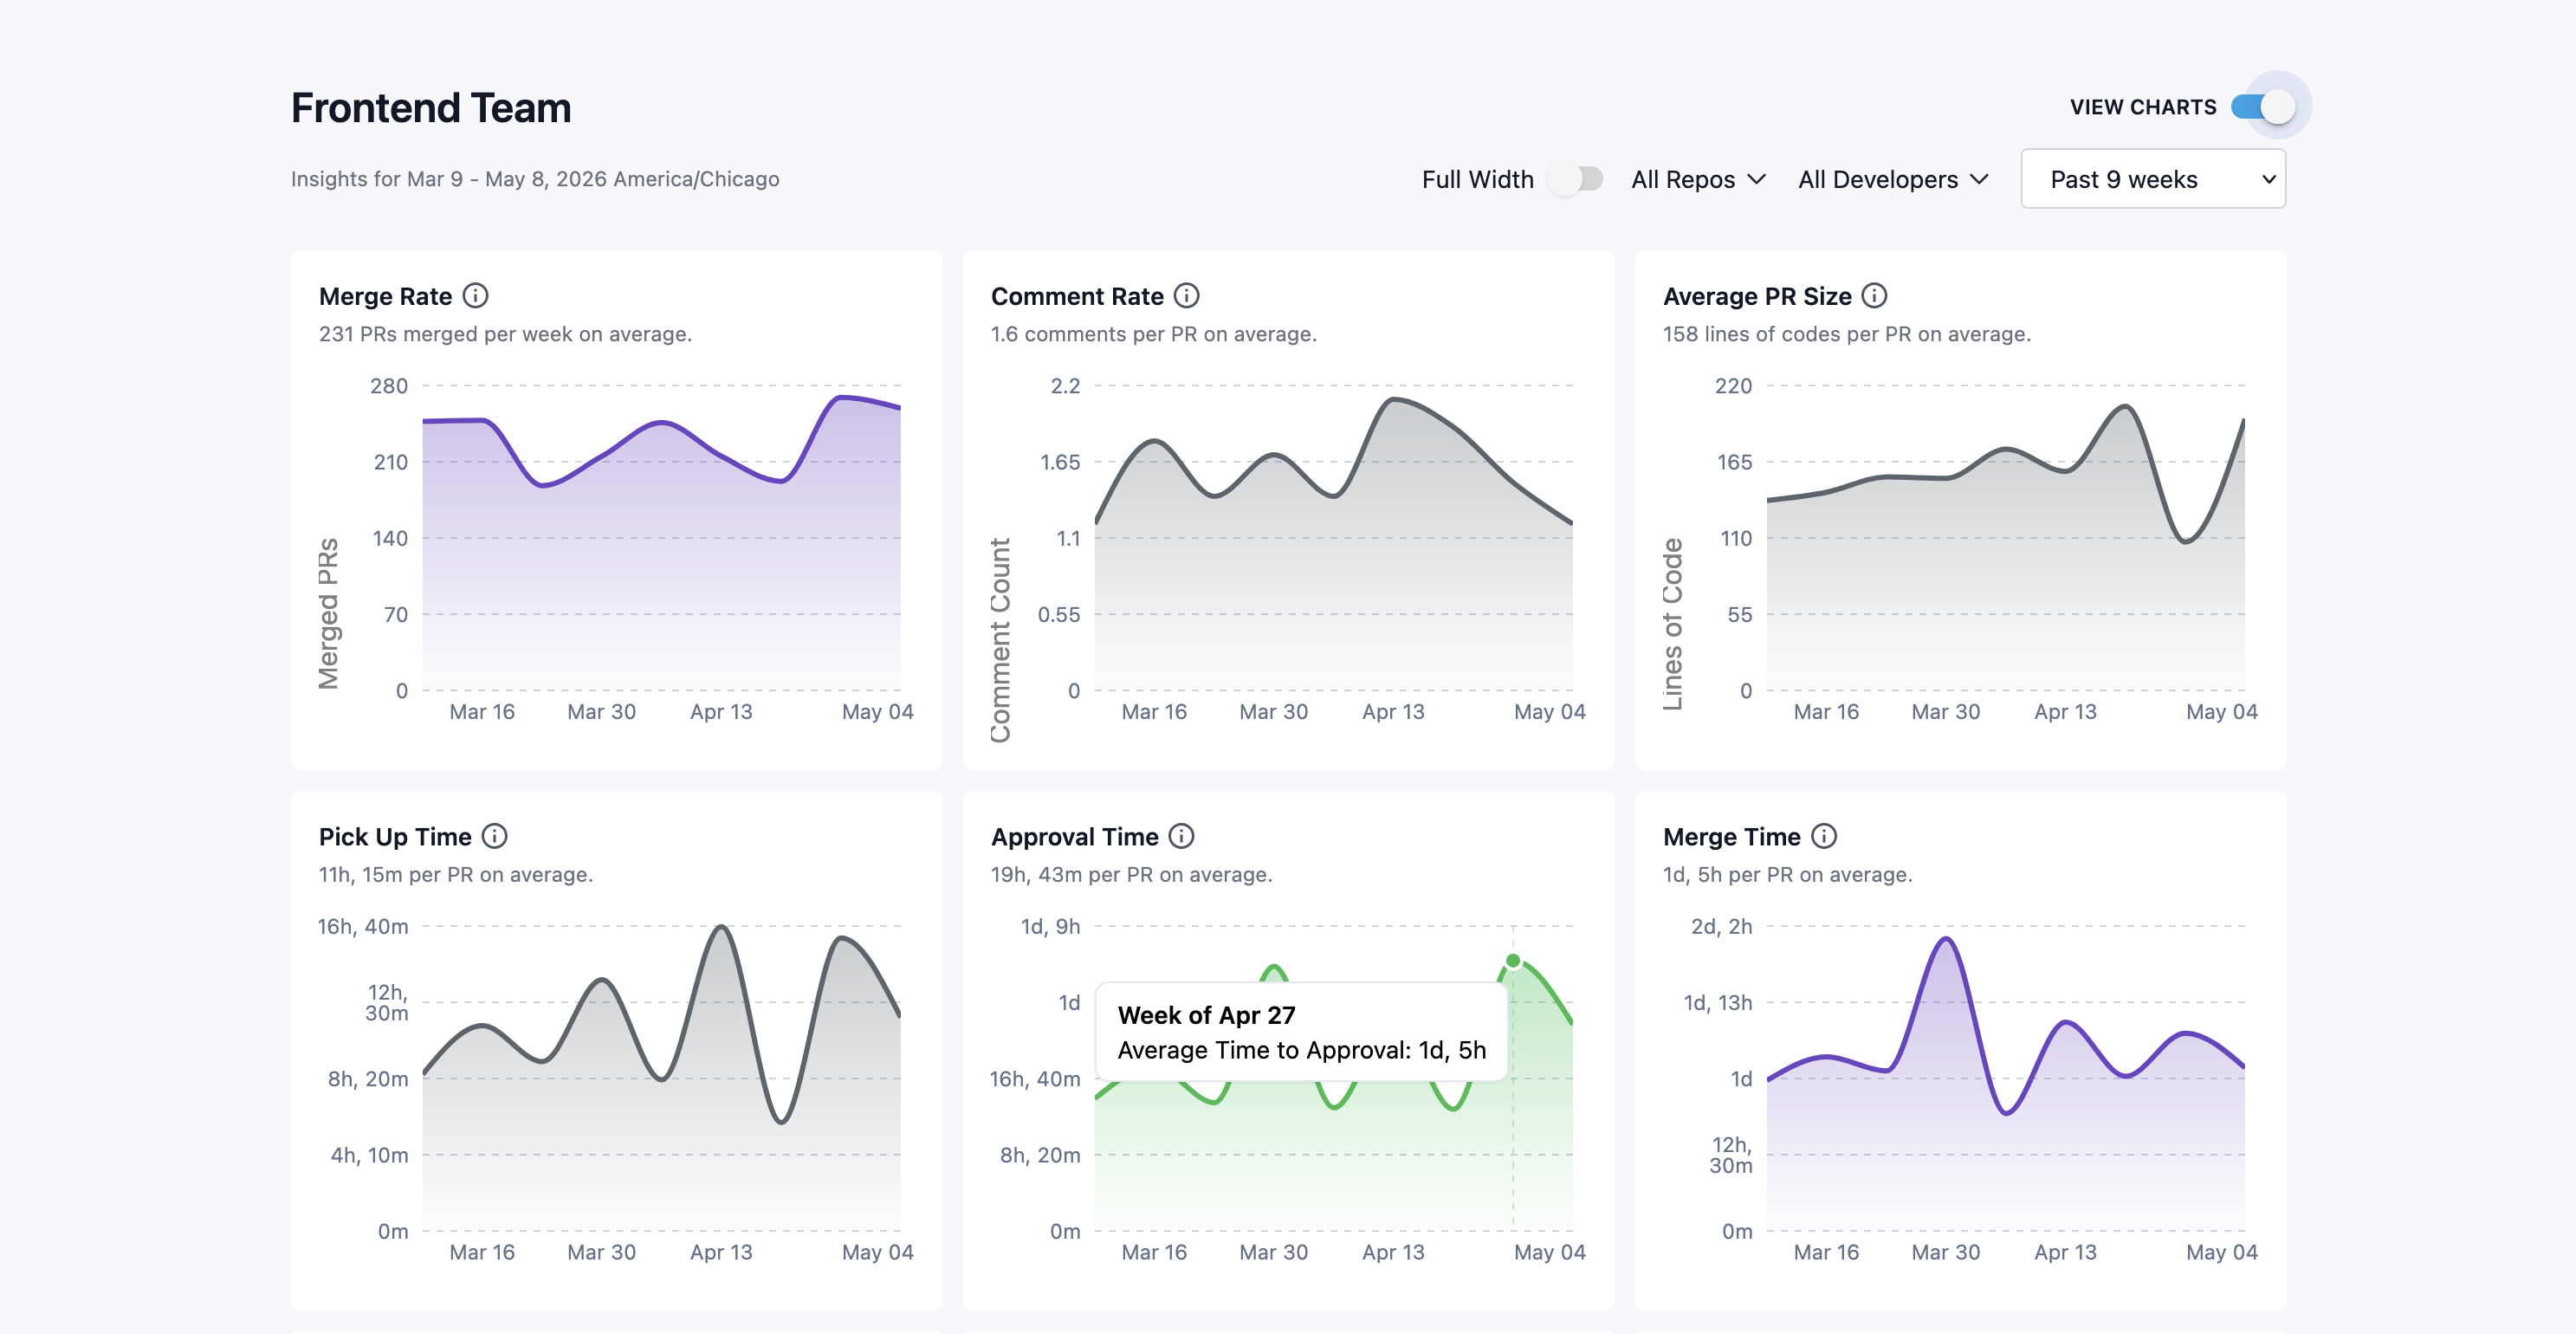
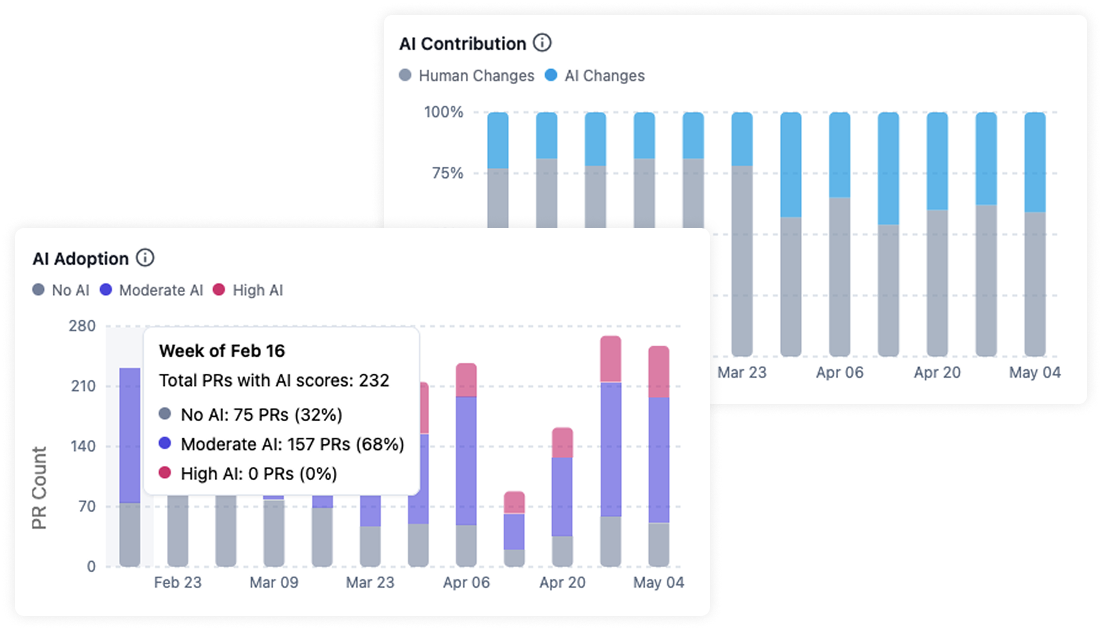
GitInsights turns GitHub activity into signals that help engineering leaders understand delivery flow, review health, quality trends, and AI impact.

A few helpful notes

  • Metrics reflect the repositories, teams, and date range you select.
  • Definitions are intentionally high level and designed to help teams interpret trends, not reverse-engineer formulas.
  • An optional timezone can be specified to exclude non-business hours from time-based metrics.
Example of GitInsights charts dashboard
Review Flow Quality & Scope AI Metrics

Review Flow

These metrics help you understand how quickly work moves through review and how much collaboration happens before code is merged.

Merge Rate

Shows how steadily your team turns open pull requests into merged changes during the selected period.

Comment Rate

Highlights how much review discussion each pull request tends to generate, helping you gauge review depth and collaboration.

Pick Up Time

Measures how quickly new pull requests receive meaningful human attention after they are opened.

PR Review Breakdown

Summarizes the mix of approvals, requested changes, and comments so you can understand how reviews are landing across the team.

Approval Time

Shows how long pull requests typically wait before they are approved and ready to move forward.

Merge Time

Captures end-to-end pull request cycle time, helping you spot delays between opening work and getting it merged.

Quality & Scope

These metrics help you understand the size and quality profile of the work your team is shipping.

Average PR Size

Estimates how large incoming pull requests tend to be, making it easier to spot batching habits and reviewability concerns.

Defect Rate

Shows how much of merged work is focused on bug fixing, giving you a quick read on quality pressure and maintenance load.

AI Metrics

These metrics help you understand how AI-assisted work is showing up across your engineering organization.

AI Adoption

Shows how much of your pull request volume includes AI-assisted work, helping you track adoption trends across teams and over time.

AI Contribution

Estimates how much of the code change volume in AI-assisted pull requests comes from AI-generated work versus human-authored changes.

Charts showing AI adoption and AI contribution trends in GitInsights

AI metrics are designed to show directional trends and relative changes, so leaders can understand adoption and impact without getting lost in raw activity alone.

Data Coverage

GitInsights continuously collects GitHub activity so your reporting stays current and useful.

Webhook Collection

GitInsights uses GitHub webhook activity to keep metrics up to date.

Historical Backfill

When you install the GitHub App, GitInsights begins tracking new activity right away and also pulls in a recent window of historical activity to give teams context from day one.

© 2026 GitInsights. All Rights Reserved.

Home Terms of Service Privacy Policy Support Documentation